
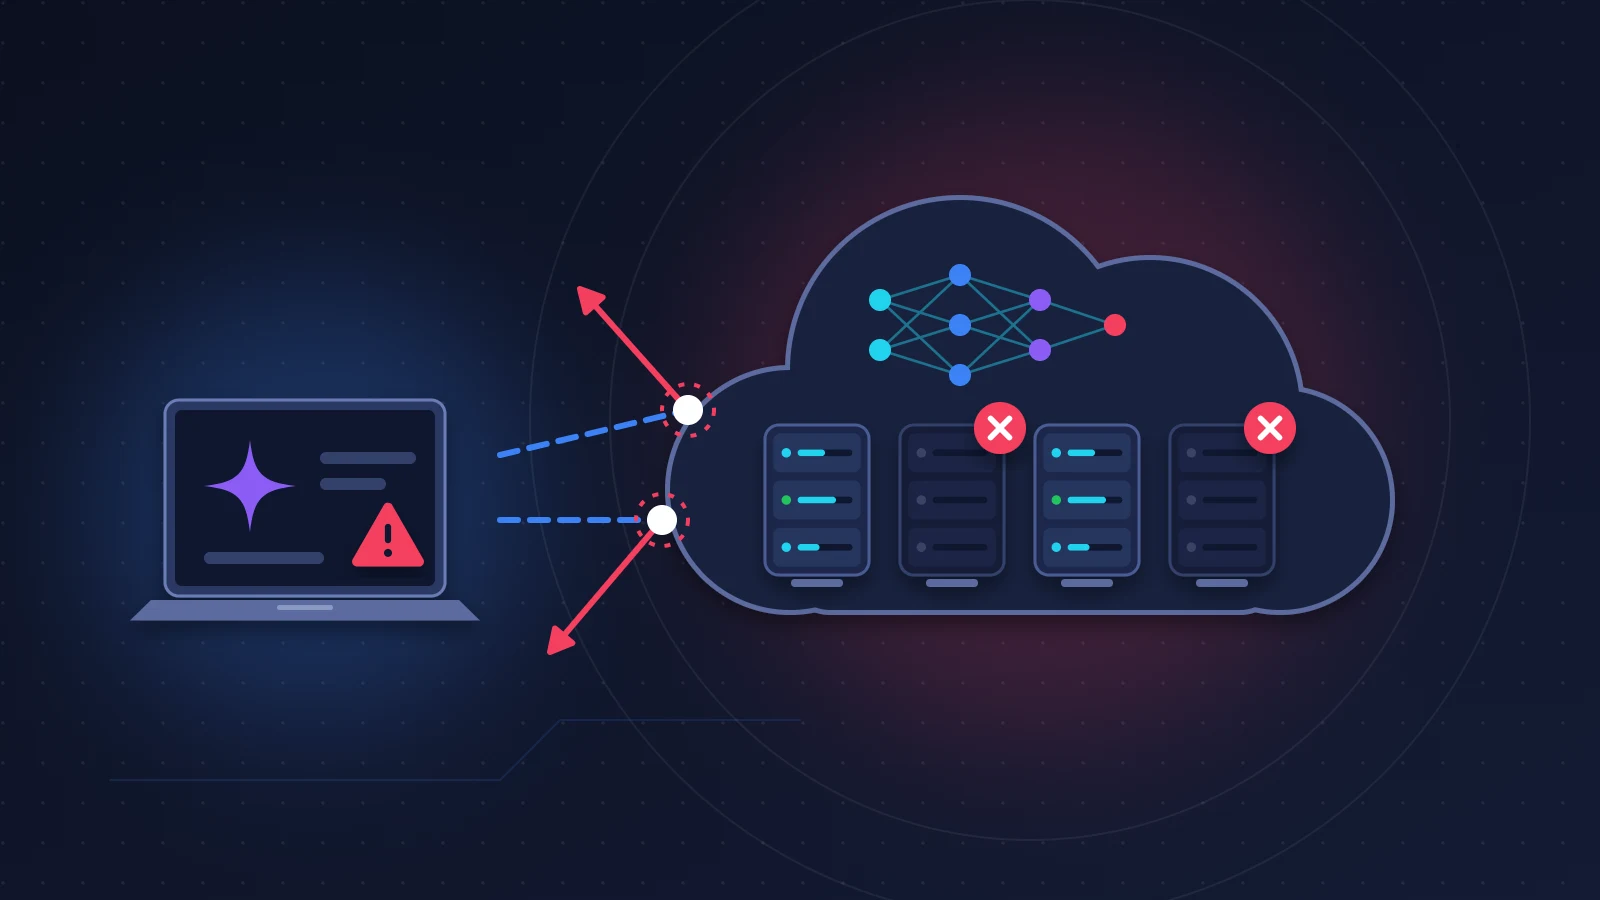
An Azure outage almost never shows up as a tidy “service unavailable” screen: what you see are API calls failing with 429, 500, 503 or 504, responses three times slower than usual, and errors that keep coming after the status page has gone back to green. Before touching your code, check the state of the platform at three levels (public page, Service Health, Resource Health), then read the HTTP code and the error message: they tell you whether the problem comes from Microsoft, from your quota or from your request. In most cases the right reaction comes down to three moves: retry with a growing, randomized delay, honor the retry-after-ms header, and fail over to a second deployment if the requested wait is too long.
At a glance: the quick fix
- Open azure.status.microsoft, then Service Health in the Azure portal. The public page only shows large-scale incidents; Service Health shows what affects your subscriptions.
- Look at the code returned. 400, 401, 403, 404: the problem is on your side and retrying is pointless. 429, 500, 502, 503, 504 and timeouts: transient errors, to be retried with restraint.
- On a 429, read the message. “Rate limit is exceeded” points to your quota; “high demand” or “temporarily unable to process” points to platform capacity.
- Cap the number of attempts (five, not fifty), space them out exponentially with some randomness, and set a short timeout.
- If the region stops responding, point the application to a backup deployment with a simple configuration change.
Recognizing the problem
Some requests go through, others fail, with no apparent logic. Response times stretch out before the errors start. The logs fill up with messages like these:
429 Too Many Requests, along with “Rate limit is exceeded” or “Requests to … have been limited”;429with “The service is temporarily unable to process your request” or “System is experiencing high demand”, sometimes theno_capacitycode;500with an almost empty body ("type": "server_error"),502 Bad Gateway,503 Service Unavailable,504 Gateway Timeout;- on the Python SDK side:
RateLimitError,InternalServerError,APITimeoutError,APIConnectionError.
Here is how to read each code and whether to try again.
| Code | What it means | Retry? | Correct reaction |
|---|---|---|---|
| 400 | Invalid request: wrong parameter, context too long, filtered content | No | Fix the request |
| 401 / 403 | Invalid key, missing role, firewall or private network blocking | No | Check key, identity, network rules |
| 404 | Wrong deployment name or endpoint | No | Check the deployment name, not the model name |
| 408 | The server gave up on a request that was too slow | Yes | Retry with a delay; reduce the size of the response |
| 429 | Too many requests: quota reached, burst, or shared capacity saturated | Yes | Wait for the time given by retry-after-ms, then retry |
| 500 | Internal service error | Yes, a few times | Backoff with jitter; fail over if it lasts |
| 502 / 504 | An intermediary (gateway, proxy, load balancer) got no valid or timely response | Yes | Backoff; enable streaming for long generations |
| 503 | Service overloaded or unavailable; also returned by a gateway whose circuit breaker is open | Yes | Backoff, then fail over to another deployment |
| Timeout, dropped connection | The network or the service is not responding | Yes | Short timeout, bounded number of attempts |
Why it happens
Three causes hide behind the same symptoms, and you need to tell them apart.
The first is a platform outage: a network, storage or compute fault in one or more regions. Your resources still exist, but the path to reach them is cut or slowed down.
The second has to do with your limits. Each Azure OpenAI deployment gets a throughput in tokens per minute (TPM) and a number of requests per minute (RPM) derived from it. These ceilings are not measured over the whole minute: the service evaluates the pace over windows of one to ten seconds. A burst sent within the same second can trigger a 429 while the total for the minute stays well below the quota. Another surprise documented by Microsoft: the calculation takes the max_tokens value into account, not the actual length of the response.
The third is the least well known. Standard deployments, billed pay-as-you-go, draw on capacity shared between customers. When demand gets close to the limit, the service temporarily lowers the effective ceiling of some deployments. You get 429s without having changed anything. The clue is in the response headers: x-ratelimit-limit-tokens shows a value below the configured TPM. According to Microsoft, this adjustment generally clears up within a few hours.
Why errors persist after the official recovery
“Service restored” means the cause has been fixed, not that everything is back to normal on your end. Several mechanisms drag the trouble out.
When the service comes back, every client that was failing retries at the same time. This retry storm saturates a platform that is still recovering and produces new 429s and 503s. On top of that come the jobs that piled up in queues during the interruption and now pour out all at once. DNS caches play a part too: a traffic router like Traffic Manager works at the DNS level, and until the record’s time to live (TTL) has run out, some clients keep aiming at the old address. Circuit breakers that tripped during the incident keep blocking traffic until their timer ends. Finally, the temporary ceiling reduction described above often outlives the incident itself.
Before you start
Do not change your quotas, your keys or your network rules in the middle of an incident: you would muddy the diagnosis.
Write down right away what you will need later: start time in UTC, region, deployment name, codes returned, and a few request IDs taken from the response headers. Without these, a request for analysis or for a credit goes nowhere.
Finally, check that you can change the endpoint without redeploying: an environment variable or a configuration service, never a hard-coded address.
Solution 1: Confirm the Azure outage at three levels
Do this first, with no risk at all.
1. The public status page
Go to azure.status.microsoft. It gives a worldwide view by service and by region. Its weakness: only widespread incidents appear there, typically those that hit several services across an entire region. An all-green page therefore proves nothing.
2. Service Health in the portal
In the Azure portal, type “Service Health” in the search bar. The Service issues section lists the incidents that concern your subscriptions and your regions, with a tracking ID and a thread of updates. This is the source to trust.
3. Resource Health on the resource
Open the affected resource, then Resource health in the left menu. Four states exist: Available, Unavailable, Degraded and Unknown. The tool tells a platform event apart from an event caused by an action on your side.
How to verify: if Service Health reports an incident on your region and your service, stop digging through your code and move on to solutions 3 to 5.
Solution 2: Tell a platform outage from an exceeded quota or a bug in your code
When nothing has been announced, let your data do the talking. In Azure Monitor, display the Azure OpenAI Requests metric and split it by StatusCode and by ModelDeploymentName.
- Only 4xx codes other than 429, appearing after a release: your code or your configuration.
- 429s on a single deployment, at peak hours, with the message “Rate limit is exceeded”: quota or bursts. Lower
max_tokens, smooth out your traffic, raise the deployment’s TPM. - “High demand” 429s with an
x-ratelimit-limit-tokensbelow your TPM: shared capacity under strain. - 5xx codes and timeouts on every deployment in the same region: a platform problem, even if nothing has been published yet.
One test settles it: the same call against a deployment located in another region. If it goes through, your code is not to blame.
Solution 3: Retry properly, with exponential backoff and jitter
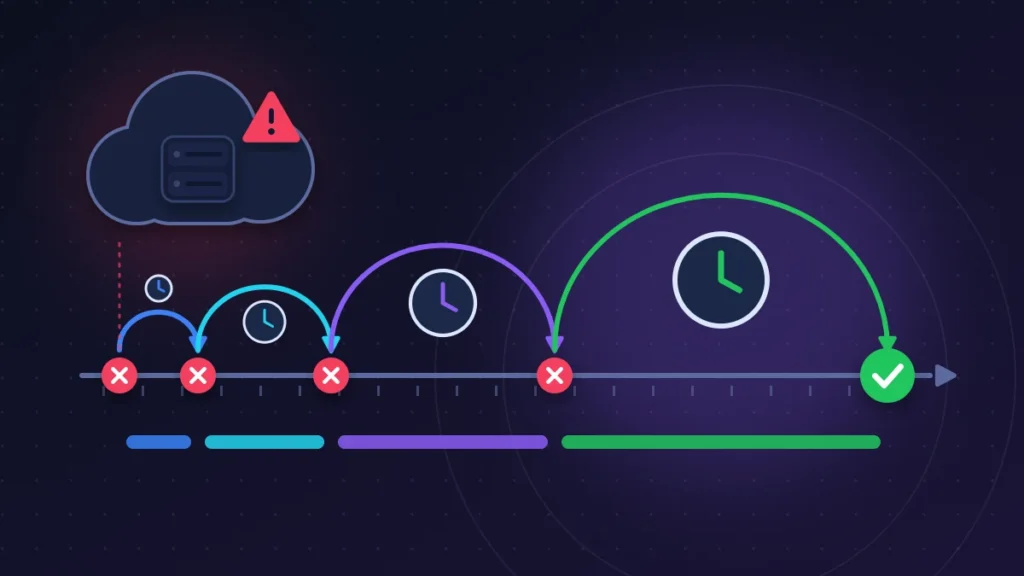
The fix that solves the most cases is also the one most often written wrong. Exponential backoff means doubling the delay between two attempts. Jitter adds a dose of randomness to it, so that a thousand clients do not all retry in the same millisecond.
The openai Python SDK already retries on its own, twice by default, on connection errors, 408, 409, 429 and codes 500 and above. Setting max_retries to 5 is enough for many applications. To control the logic yourself, turn off the SDK’s retries, otherwise the two mechanisms multiply each other. The example below was run against a test server returning 429, 500, 502, 503 and 504 in succession.
import os
import random
import time

import openai
from openai import OpenAI

client = OpenAI(
    base_url=os.environ["AZURE_OPENAI_ENDPOINT"].rstrip("/") + "/openai/v1/",
    api_key=os.environ["AZURE_OPENAI_API_KEY"],
    max_retries=0,  # retries are handled below: no double retry
    timeout=30.0,   # without this, the SDK waits up to 10 minutes
)

# 429s, 5xx errors, timeouts and dropped connections: nothing else
A_REESSAYER = (
    openai.RateLimitError,
    openai.InternalServerError,
    openai.APITimeoutError,
    openai.APIConnectionError,
)


def delai_demande_par_le_serveur(exc):
    """Reads retry-after-ms or retry-after, in seconds. None if absent."""
    reponse = getattr(exc, "response", None)
    if reponse is None:
        return None
    try:
        if "retry-after-ms" in reponse.headers:
            return float(reponse.headers["retry-after-ms"]) / 1000
        if "retry-after" in reponse.headers:
            return float(reponse.headers["retry-after"])
    except ValueError:
        pass
    return None


def appel_resilient(max_tentatives=5, base=1.0, plafond=30.0, **parametres):
    for tentative in range(1, max_tentatives + 1):
        try:
            return client.chat.completions.create(**parametres)
        except A_REESSAYER as exc:
            if tentative == max_tentatives:
                raise
            attente = delai_demande_par_le_serveur(exc)
            if attente is None:
                # exponential backoff with jitter: a duration picked at random
                # between 0 and a cap that doubles after each failure
                attente = random.uniform(0, min(plafond, base * 2 ** (tentative - 1)))
            elif attente > plafond:
                raise  # wait too long: better to fail over elsewhere
            time.sleep(attente)
The call is then made with appel_resilient(model="your-deployment-name", messages=[...]).
Three pitfalls. 400, 401 and 404 errors are never retried: they would fail the same way. A retry-after can announce a huge wait, up to a full day according to the API Management documentation, hence the exception raised beyond the cap. And retry at one layer only: if your function, your SDK and your gateway each retry three times, one request becomes twenty-seven.
How to verify: outside an incident, the average number of attempts per call should stay close to 1. If it climbs, your quota is too tight.
Solution 4: Timeouts, queues and degraded mode
The SDK’s default timeout is ten minutes. During an outage, that means blocked threads and a web server that chokes. Set a timeout suited to your use case, and enable streaming (stream=True) for long responses: tokens arrive as they are generated and intermediaries no longer cut the connection for inactivity. Many 504s disappear this way.
Anything that does not need an immediate answer (summaries, classification) should go through a queue consumed at a controlled pace. It absorbs the outage, then drains without a burst.
Finally, plan a degraded mode: a response served from a cache, a lighter model, or simply an honest message saying the assistant is temporarily unavailable. A form that works without automatic suggestions beats an error page.
Solution 5: Fail over to another deployment or another region
Create a second Azure OpenAI resource in another region ahead of time, with the same model in the same version, and keep its address in your configuration. Failing over then comes down to changing a variable. Nothing is synchronized between the two: files and settings have to exist on both sides.
The deployment type matters. A Global Standard deployment routes traffic to the data centers available worldwide; a Data Zone Standard does the same within a zone (United States or European Union, for example); a regional Standard stays in its geography. Microsoft recommends Global Standard when your data residency constraints allow it, Data Zone otherwise. This routing does not replace a failover managed by your application: the entry point remains tied to one region.
Careful: Global Standard quotas are shared across regions for the same model within a subscription. Two deployments do not necessarily double your throughput.
Solution 6: An API Management gateway with load balancing and a circuit breaker
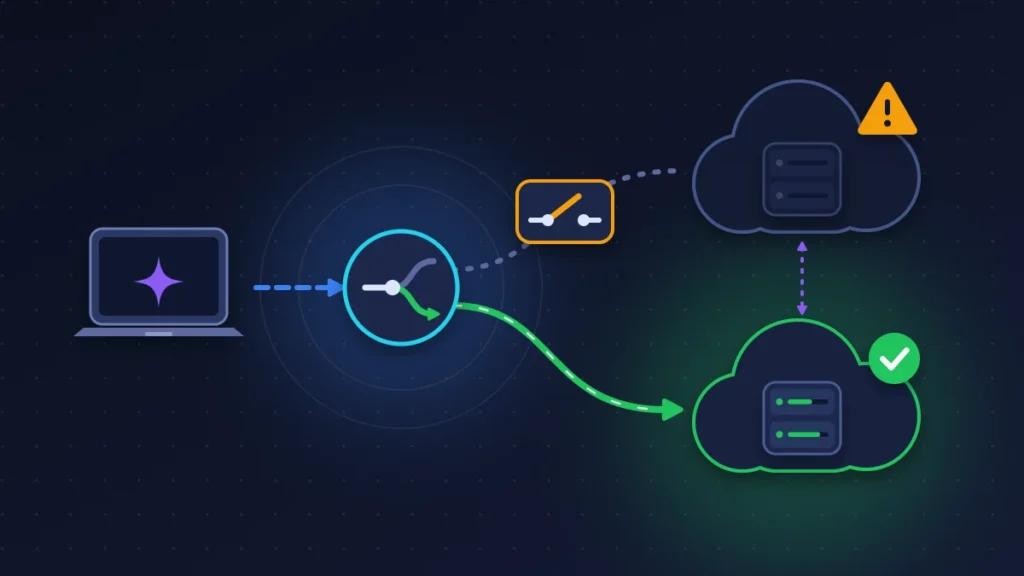
When several applications call the models, duplicating the failover logic in each of them becomes unmanageable. Azure API Management can act as a gateway: a backend pool groups your endpoints, with round-robin, weighted or priority-based distribution.
The circuit breaker completes the setup. You define a number of failures over an interval and a range of codes, for example 429 and 500 to 599. Once the threshold is crossed, the gateway stops sending traffic to that backend for a set duration and serves the next one. The acceptRetryAfter option aligns that duration with the header returned by the service. The circuit breaker is not available in the Consumption tier of API Management, and only one rule is allowed per backend.
The flip side: the gateway itself becomes a point of failure. With a single application, a failover coded on the client side costs less.
Solution 7: Reserve capacity for critical workloads
If your product can tolerate neither variable latency nor capacity 429s, provisioned throughput (PTU) reserves processing power for your deployment. Once the units are 100% used, the service immediately answers 429 with retry-after-ms: that is a flow-control signal, not an outage. The spillover feature then automatically sends the excess to a Standard deployment in the same resource, same model and same version.
Summary table
| Symptom | Likely cause | Solution to try |
|---|---|---|
| 5xx and timeouts across a whole region | Platform outage | Solutions 1, 3 and 5 |
| 429 “Rate limit is exceeded” at peak hours | Quota or bursts | Lower max_tokens, smooth traffic, raise the TPM |
| 429 “high demand” with an unchanged quota | Shared capacity reduced | Solution 3, then 5 or 7 |
| 504 on long generations | An intermediary’s timeout exceeded | Streaming, shorter response |
| Errors that last after recovery | Retry storm, queues, DNS, circuit breakers | Jitter, gradual queue draining, patience |
If nothing works
Open a support request from the portal (the “?” icon, then Create a support request). Technical support requires a paid plan; billing, quota and subscription management questions are handled without one. Attach the details you noted earlier. Lasting 429s in production while you are under your quota justify an escalation.
To understand what happened, wait for the post-incident review (PIR). Microsoft generally publishes it within two weeks: on the Azure Status history page for the broadest incidents, in Service Health for customers affected by the others.
The service credit, for its part, is never paid out automatically. If the monthly availability guaranteed by the service level agreement (SLA) was not met, it is up to you to file a claim with support, under the billing category, with proof of the impact: resources affected, duration, tracking ID of the incident. The claim has to arrive within a limited period after the month of the incident. The credit takes the form of a percentage deducted from the bill for the affected service; it does not make up for your lost revenue.
Keeping it from happening again
Create a Service Health alert: in Service Health, click Create service health alert, choose the subscription, the services, the regions and the event types, then an action group (email, SMS, webhook). Microsoft advises selecting all services and all regions: the alert only fires for what you actually use. Resource Health needs its own rule.
Add alerts on your own signals: 429 rate, 5xx rate, response time.
Test the outage before it happens: in pre-production, inject 503s with a fake server and watch what the application does. Azure Chaos Studio automates this kind of exercise.
The checklist to keep at hand:
- endpoint in configuration, never hard-coded;
- explicit timeout on every call;
- bounded retries, with backoff, jitter and respect for
retry-after-ms, at one layer only; - second deployment ready in another region, same model, same version;
- queue for work that can be deferred;
- degraded mode planned and tested;
- Service Health alerts and alerts on 429s and 5xx;
- failover drill repeated every quarter;
- request IDs kept in the logs.
Two misconceptions to finish. Availability zones protect against the failure of a data center, not of an entire region. And deploying in a paired region does not trigger any automatic failover: Microsoft only initiates one in the event of a disaster.
Frequently asked questions
The Azure status page is green but my calls are failing. Is that possible?
Yes. The public page only lists large-scale incidents. Check Service Health in the portal, then Resource Health on the resource.
Why am I getting 429 errors when my usage is far below the quota?
Either your requests arrive in bursts within a one-to-ten-second window, or max_tokens is set too high, or the effective ceiling of your Standard deployment has been lowered temporarily. Compare x-ratelimit-limit-tokens with your configured TPM.
How many attempts should I plan for?
Few for a user interface, more for background processing. Microsoft cites a maximum of five to ten on 429s.
Does a Global Standard deployment spare me from going multi-region?
No. Microsoft states that this routing does not replace a regional failover managed by the application.
An Azure outage is something you prepare for far more than something you endure: a timeout, disciplined retries and a backup deployment are enough to turn an interruption into a mere slowdown. If you have run into an error code missing from this guide, or found a workaround that holds up in production, tell us about it in the comments.
Share this content: